Run History
Monitor every pipeline run with filters, a sortable table view, and paginated results.
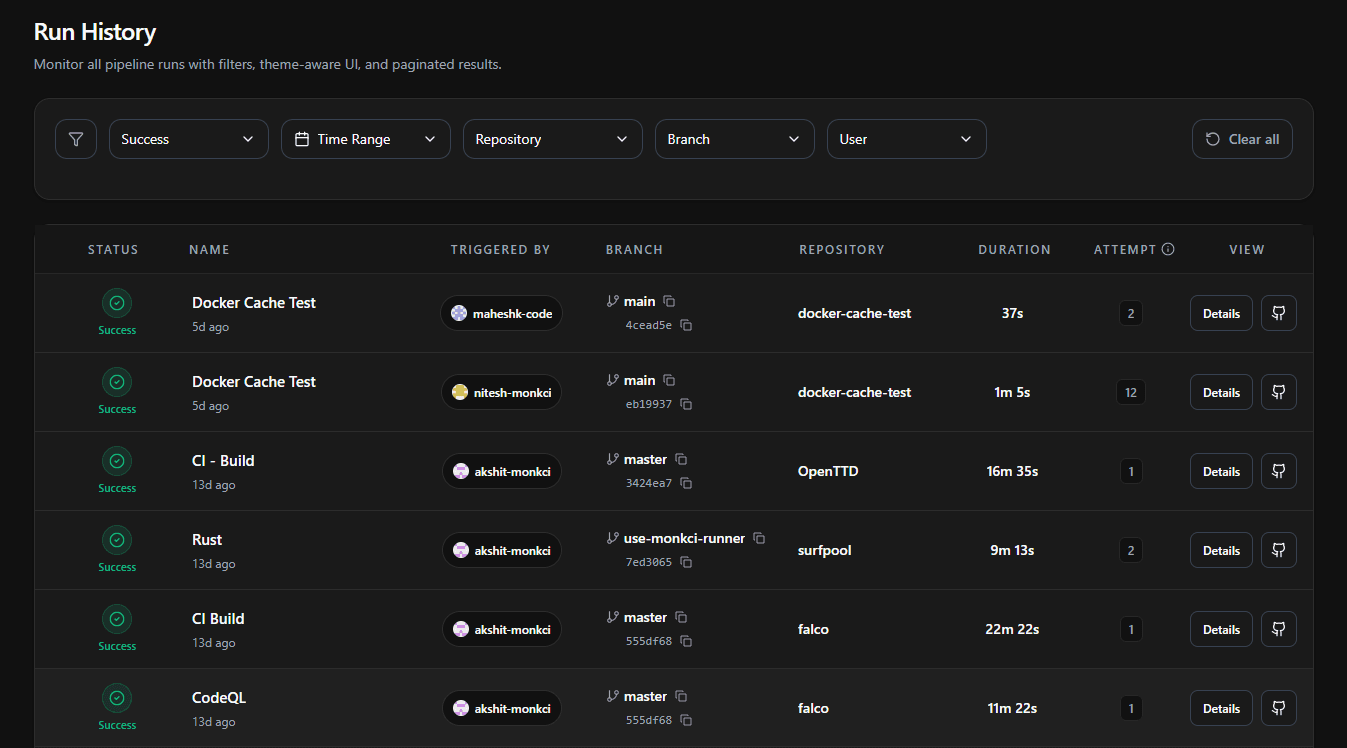
The Run History page is the central hub for monitoring, auditing, and debugging your CI/CD pipelines in Monk CI. It lists every pipeline run in a dense, filterable table - so your team can track status, trace commits, and drill into failures fast.
Filtering Runs
The filter bar at the top of the page lets you narrow the run list. Filters are additive - combine them to scope down to exactly the runs you care about.
| Filter | What it does |
|---|---|
| Status | Show only runs of a given outcome - e.g. Success or Failed. |
| Time Range | Limit the list to runs that started within a selected window. |
| Repository | Scope to a single repository in your organization. |
| Branch | Show runs for a specific branch. |
| User | Show runs triggered by a specific team member. |
Use Clear all in the top-right of the filter bar to reset every filter and return to the full list.
Tip: Focus on Failures First
Set the Status filter to Failed to surface actionable runs immediately, so your team can prioritize fixes without scanning through successful runs.
The Run Table
Each row is a single run. The columns give you an at-a-glance snapshot plus the metadata you need for traceability.
| Column | Description |
|---|---|
| Status | The run's outcome, shown as a colored icon and label. |
| Name | The workflow name, with how long ago the run started underneath. |
| Triggered By | The avatar and username of the person who triggered the run. |
| Branch | The branch and the short commit SHA, each with a one-click copy button. |
| Repository | The repository the run belongs to. |
| Attempt | The number of times the run has been attempted, including re-runs. |
| View | Actions to open the run - see Viewing a Run below. |
Run Status
Every run is tagged with one of the following statuses. Use them to triage pipeline health at a glance.
| Status | Description |
|---|---|
Success | The run completed all steps without errors. |
Failed | An error was encountered and the run halted prematurely. |
Running | The run is currently being executed by an active runner. |
Queued | The run is waiting for an available runner. |
Cancelled | The run was stopped before completion. |
Viewing a Run
The View column on each row gives you two ways to inspect a run:
Details - Opens the run inside Monk CI, where you can see each job, its status, duration, runner, and logs, plus the AI summary for any failed job. See AI Log Summary.
Open on GitHub - The GitHub icon button opens the corresponding run on GitHub in a new tab.
Pagination
The run table is paginated. Use the pagination controls below the table to move through older runs. Narrowing the list with the filters above is the fastest way to find a specific run without paging through history.
Pricing
No Additional Cost
Run History is included in all Monk CI plans at no extra charge. For details on overall platform pricing, visit the Pricing page.