How fast should your CI pipeline be?
How fast should your CI pipeline be? Benchmark your build times against real tiers, find where the time goes, and cut it with caching and faster runners.
By Himanshu Sharma · Published
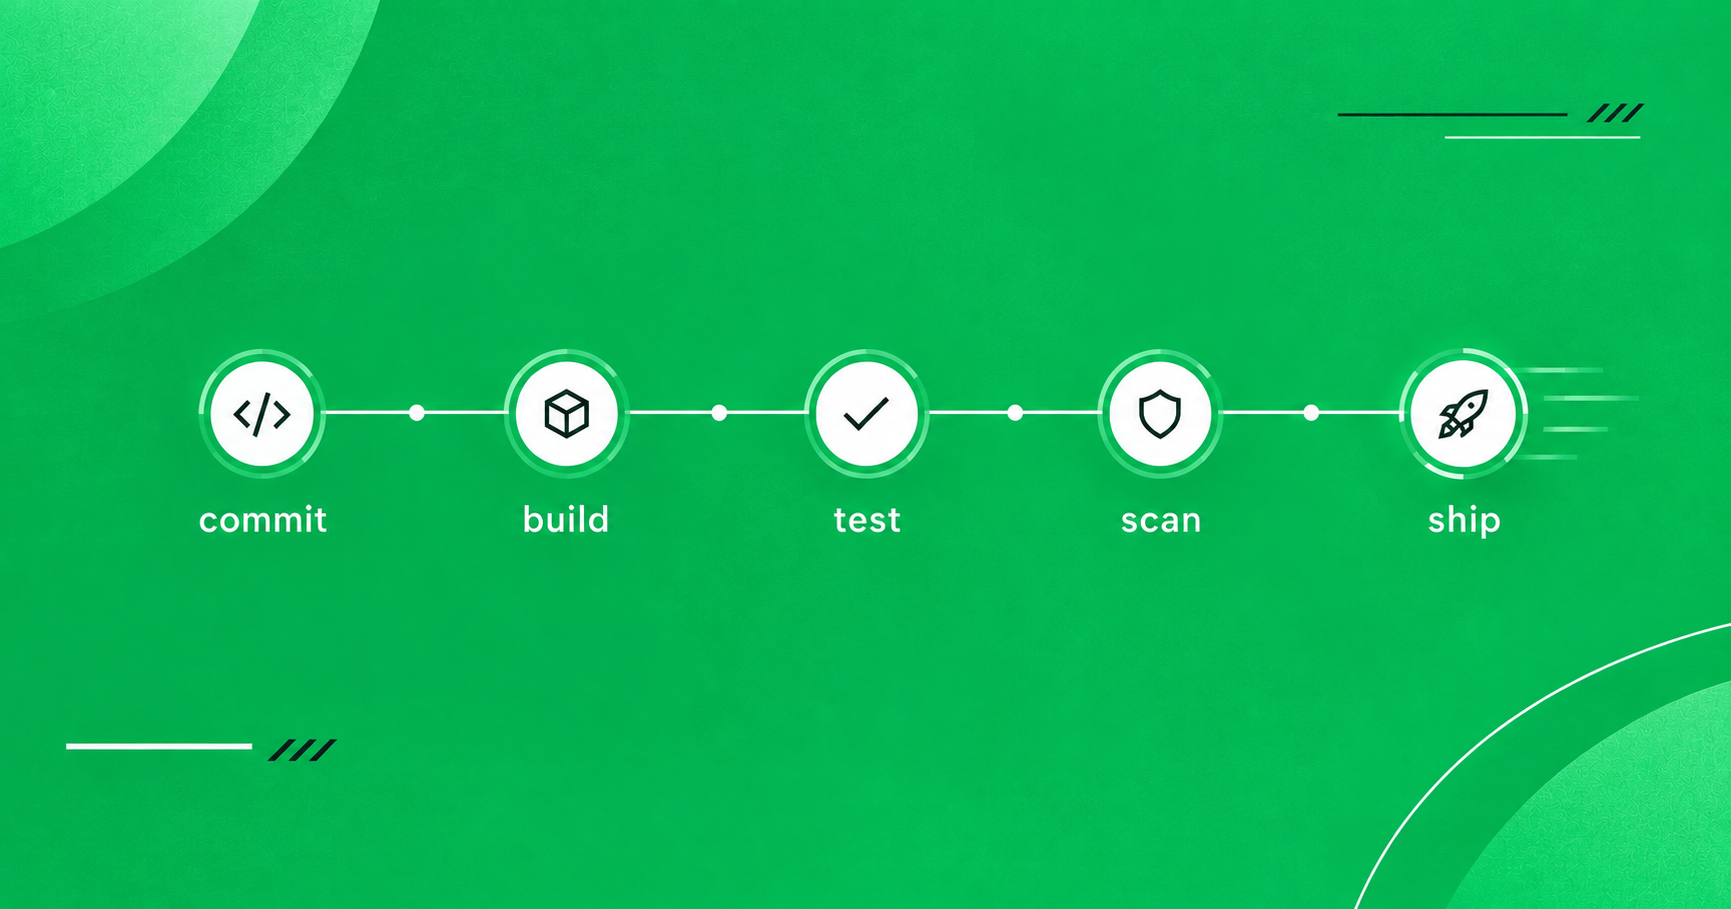
Your team ships code faster every month. If build times are standing still, CI has quietly become the thing everyone waits on. Here is how to benchmark where you stand, and how to fix it.
CI became the bottleneck when nobody was looking
Code moves fast now. Small pull requests, many merges a day, and a good chunk of it drafted with AI assistance. The one thing that has not kept up on most teams is the pipeline that has to check all of it.
A slow build does not just cost minutes. It breaks focus. People open another tab, lose the thread, and come back cold. Take one 40-minute pipeline, multiply it by every engineer, every push, every day, and you are paying a real tax on the whole team. That is why build time is worth treating as a number you own, not background noise you tolerate.
So what actually counts as fast?
There is a well-worn rule of thumb: a developer should get feedback in under ten minutes. The data backs it up. In DORA's State of DevOps research, elite performers keep a typical CI build under 10 minutes, while low performers sit above an hour. Under 5 minutes for a pull-request build is the level most teams should aim for.
Grade the everyday build that runs on most pull requests, not your longest nightly job. Those are different animals.
| Where you land | PR feedback time | What it means |
|---|---|---|
| Best | under 5 min | Nobody waits. CI is invisible. |
| Great | 5 to 10 min | Healthy. Stay here as you scale. |
| Fair | 10 to 20 min | Starting to bite. Worth a look. |
| Poor | 20 to 45 min | People are context-switching to cope. |
| Very poor | 45 min and up | CI is now a blocker. Fix it first. |
Measure per step, not the total
Total duration tells you that you have a problem. It does not tell you where. Two pipelines can both run 22 minutes: one burns it all on installing dependencies, the other on tests. The fix is completely different, so the total is almost useless on its own.
Every CI platform already shows timing for each step. Open it and read the build stage by stage before you change anything. Most teams get a surprise here. The step they assumed was slow often is not, and the real cost is hiding in setup or the container build.
One build, 22 minutes, broken down:
| Step | Time |
|---|---|
| checkout | 0:30 |
| install deps | 8:00 |
| docker build | 9:00 |
| tests | 3:30 |
| upload | 1:00 |
Install and docker build eat 17 of the 22 minutes. That is where the win is, not in the tests.
How to actually benchmark your pipeline
Pick two workflows to measure. Your everyday one, the build that runs on most pull requests, and your heaviest one, the big Docker build or the full test suite. Run each a few times and record the per-step timing. That is your baseline.
Then run the same workflows on other setups and compare the same steps side by side: standard hosted runners (the default, such as GitHub's), self-hosted runners on your own hardware, and high-performance runners from a provider. Comparing one identical job across all three is the only honest way to know whether your machines are the ceiling.
Faster machines are the easy 10x
The cheapest win is often just better hardware. Standard hosted runners are shared, modest boxes. Move a heavy job onto tuned, dedicated runners and the same steps finish in a fraction of the time, with no change to your pipeline config. Providers like Monk CI run high-performance runners that can cut workflow time by up to 10x. If your baseline showed the machine is the ceiling, this is the fastest lever to pull.
Same heavy job, three runner types:
| Runner | Time |
|---|---|
| standard hosted | 40 min |
| self-hosted | 22 min |
| Monk CI runners | 4 min |
Your Docker build is probably the worst offender
A heavy Docker build with no remote cache rebuilds every layer from scratch on every run. On a standard runner that can crawl toward an hour. Add layer caching and the same build drops to minutes, because unchanged layers are reused instead of rebuilt. Put the cache close to the runner, the way Monk CI's Docker cache does, and it is faster still, since layers are not dragged back across the network. If one job is dragging your whole pipeline down, this is usually the one.
One Docker build, three cache strategies:
| Strategy | Time |
|---|---|
| no cache | 58 min |
| layer cache | 9 min |
| Monk CI cache | 3 min |
Stop reinstalling the same dependencies
As a codebase grows, so does its dependency tree. Left alone, CI downloads and installs all of it on every single run, even when nothing changed. That is dead time you pay for constantly. Cache your dependencies (npm, pip, Maven, Go modules, whatever you use) and CI restores them instead of fetching from scratch. New or changed packages still get installed. Everything else is reused.
Dependency install, cold run vs cached run:
| Run | Time |
|---|---|
| first run (cold) | 9:00 |
| later runs (cached) | 1:00 |
Install is often the first 5 to 10 minutes of a build, so caching it can move you up a whole tier.
Where to start
You cannot improve what you have not measured, so begin there and work down the list.
- 1Pull up per-step timing for your everyday build and your heaviest build.
- 2Grade each one against the tiers above.
- 3Cache your dependencies so you stop reinstalling them on every run.
- 4Add layer caching to your Docker builds.
- 5If the machine is the ceiling, move heavy jobs onto high-performance runners.
- 6Re-measure, and keep the number visible so it does not creep back up.
Fast CI is not a one-time cleanup. It is a metric worth watching, the same way you watch production. Keep the everyday build under ten minutes and the whole team stays in flow.
See the 10x on your own workflow. Run your heaviest build on Monk CI's high-performance runners and Docker cache, and compare it step by step against your current baseline. Try it on Monk CI
Benchmark references: DORA State of DevOps research (elite performers keep CI builds under 10 minutes; low performers exceed an hour). Timing figures in the tables are representative examples, not measured results.